


Epidemiologia e prevenzione delle malattie cerebro e cardiovascolari

Epidemiologia e prevenzione delle malattie cerebro e cardiovascolari
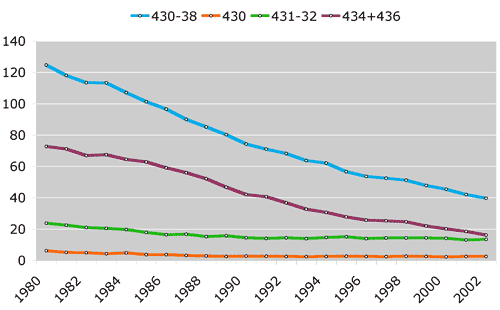
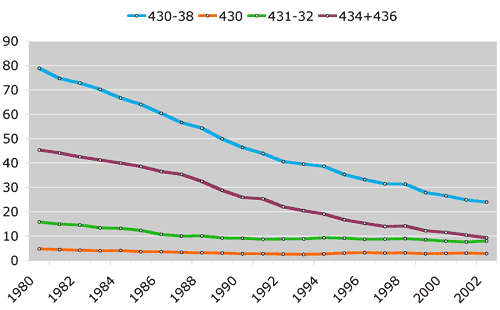
Mortality due to cerebrovascular disease is higher in men than in women and is declining slowly but steadily
The graphs (men, women) and tables (men, women) below show the trend of mortality rate due to cerebrovascular disease, sub-arachnoid haemorrhage, intracerebral haemorrhage and ischemic stroke from 1980 to 2002 in Italy. Mortality rates are age-standardized (35-74 years) using the direct method and the European reference population [Source: database on mortality in Italy of the Statistical Department of the Istituto Superiore di Sanità]. In the graphs, age-adjusted (35-74 years) mortality rates are presented using a scale from 0 to 140 per 100,000 for men and a scale from 0 to 90 per 100,000 for women.
Data are also available on mortality due to cerebrovascular disease (codes ICD-9 430-38), subarachnoid haemorrhage (code ICD-9 430), intracerebral haemorrhage (codes ICD-9 431-32) and ischemic stroke (codes ICD-9 434 e 436) for the age range 35-74 years in the different geographical areas of the country.
Men
Mortality per 100,000 due to cerebrovascular disease (codes ICD-9 430-38), subarachnoid heamorrhage (code ICD-9 430), intracerebral haemorrhage (codici ICD-9 431-32) and ischaemic stroke (codes ICD-9 434 and 436) by geographical area, men aged 35-74 (data standardized using the European population)
|
|
430-38 |
430 |
431-32 |
434+436 |
|
1980 |
124.74 |
6.21 |
23.82 |
72.80 |
|
1981 |
118.07 |
5.12 |
22.54 |
71.18 |
|
1982 |
113.47 |
4.89 |
21.08 |
66.98 |
|
1983 |
113.42 |
4.30 |
20.51 |
67.55 |
|
1984 |
107.17 |
4.86 |
19.76 |
64.55 |
|
1985 |
101.37 |
3.80 |
17.90 |
62.91 |
|
1986 |
96.66 |
3.71 |
16.45 |
59.18 |
|
1987 |
90.05 |
3.20 |
16.75 |
56.05 |
|
1988 |
85.28 |
2.91 |
15.29 |
52.19 |
|
1989 |
80.34 |
2.61 |
15.79 |
46.78 |
|
1990 |
74.32 |
2.75 |
14.48 |
42.05 |
|
1991 |
71.11 |
2.72 |
14.11 |
40.67 |
|
1992 |
68.29 |
2.60 |
14.49 |
36.81 |
|
1993 |
63.80 |
2.42 |
13.91 |
32.73 |
|
1994 |
62.12 |
2.53 |
14.66 |
30.68 |
|
1995 |
56.69 |
2.65 |
15.09 |
27.86 |
|
1996 |
53.66 |
2.63 |
13.92 |
25.77 |
|
1997 |
52.45 |
2.50 |
14.38 |
25.32 |
|
1998 |
51.21 |
2.69 |
14.42 |
24.72 |
|
1999 |
47.93 |
2.59 |
14.44 |
22.03 |
|
2000 |
45.37 |
2.39 |
14.12 |
20.16 |
|
2001 |
42.12 |
2.62 |
13.13 |
18.60 |
|
2002 |
39.70 |
2.60 |
13.54 |
16.26 |
Women
Mortality per 100,000 due to cerebrovascular disease (codes ICD-9 430-38), subarachnoid haemorrhage (code ICD-9 430), intracerebral haemorrhage (codes ICD-9 431-32) and ischaemic stroke (codes ICD-9 434 and 436) by geographical area, women aged 35-74 (data standardized using the European population)
|
|
430-38 |
430 |
431-32 |
434+436 |
|
1980 |
78.86 |
4.74 |
15.83 |
45.33 |
|
1981 |
74.65 |
4.49 |
14.93 |
44.11 |
|
1982 |
72.78 |
4.23 |
14.58 |
42.49 |
|
1983 |
70.19 |
3.99 |
13.37 |
41.22 |
|
1984 |
66.66 |
4.05 |
13.16 |
39.94 |
|
1985 |
64.06 |
3.62 |
12.37 |
38.57 |
|
1986 |
60.42 |
3.58 |
10.73 |
36.52 |
|
1987 |
56.60 |
3.30 |
10.02 |
35.37 |
|
1988 |
54.31 |
3.15 |
10.11 |
32.45 |
|
1989 |
49.92 |
3.06 |
9.26 |
28.81 |
|
1990 |
46.36 |
2.77 |
9.14 |
25.90 |
|
1991 |
43.91 |
2.79 |
8.69 |
25.23 |
|
1992 |
40.60 |
2.64 |
8.81 |
22.01 |
|
1993 |
39.55 |
2.49 |
8.84 |
20.46 |
|
1994 |
38.64 |
2.72 |
9.33 |
19.03 |
|
1995 |
35.26 |
3.06 |
9.20 |
16.70 |
|
1996 |
33.22 |
3.22 |
8.69 |
15.26 |
|
1997 |
31.45 |
3.07 |
8.74 |
13.96 |
|
1998 |
31.31 |
3.09 |
8.95 |
14.17 |
|
1999 |
27.88 |
2.76 |
8.52 |
12.23 |
|
2000 |
26.59 |
2.88 |
7.93 |
11.51 |
|
2001 |
24.87 |
3.01 |
7.59 |
10.40 |
|
2002 |
23.98 |
2.81 |
8.04 |
9.33 |
View the graphs on age-adjusted (35-74 years) mortality in the specific geographical areas from:
© Istituto Superiore di Sanita (ISS)