


Epidemiologia e prevenzione delle malattie cerebro e cardiovascolari

Epidemiologia e prevenzione delle malattie cerebro e cardiovascolari
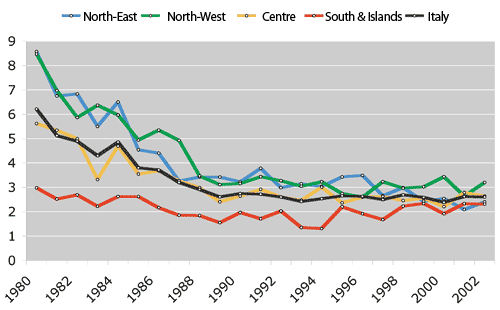
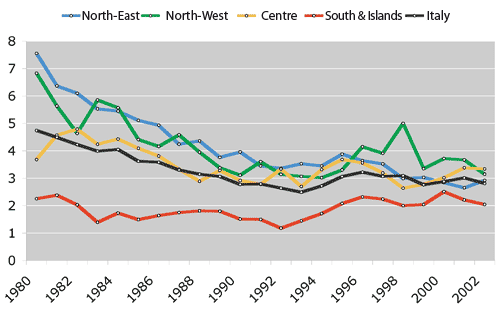
Mortality rate due to subarachnoid haemorrhage is lower in the South than in the Centre and North. Cerebrovascular disease mortality does not show the same pattern.
The graphs (men, women) and tables (men, women) below show the trend of mortality rate due to subarachnoid haemorrhage from 1980 to 2002 in the different geographical areas of the country: North-East (Trentino Alto Adige, Friuli Venezia Giulia, Veneto, Emilia Romagna), North-West (Aosta Valley, Piedmont, Liguria, Lombardy), Centre (Tuscany, Umbria, Marche, Latium), South and Islands (Abruzzi, Molise, Campania, Apulia, Basilicata, Calabria, Sicily, Sardinia). Mortality rates for persons aged 35-74 years were calculated and standardized using the direct method and the European standard population to allow for a comparison between the different geographical areas and genders. The original data come from the database on mortality in Italy of the Statistical Department of the Istituto Superiore di Sanità. In the graphs, mortality rates are presented using a scale from 0 to 9 per 100.000 for men and a scale from 0 to 8 per 100.000 for women.
Men
Mortality per 100,000 due to subarachhnoid haemorrhage (code ICD-9 430) by geographical area, men aged 35-74 (data standardised with the European population)
|
|
North East |
North West |
Centre |
South and Islands |
Italy |
| 1980 |
8.57 |
8.47 |
5.62 |
2.98 |
6.21 |
| 1981 |
6.75 |
6.97 |
5.34 |
2.52 |
5.12 |
| 1982 |
6.83 |
5.87 |
5.00 |
2.69 |
4.89 |
| 1983 |
5.50 |
6.37 |
3.32 |
2.22 |
4.30 |
| 1984 |
6.50 |
5.97 |
4.69 |
2.62 |
4.86 |
| 1985 |
4.54 |
4.94 |
3.55 |
2.62 |
3.80 |
| 1986 |
4.40 |
5.35 |
3.68 |
2.17 |
3.71 |
| 1987 |
3.26 |
4.93 |
3.27 |
1.86 |
3.20 |
| 1988 |
3.42 |
3.47 |
2.99 |
1.84 |
2.91 |
| 1989 |
3.42 |
3.11 |
2.41 |
1.55 |
2.61 |
| 1990 |
3.22 |
3.16 |
2.64 |
1.97 |
2.75 |
| 1991 |
3.78 |
3.44 |
2.92 |
1.71 |
2.72 |
| 1992 |
2.99 |
3.27 |
2.61 |
2.03 |
2.60 |
| 1993 |
3.15 |
3.05 |
2.47 |
1.35 |
2.42 |
| 1994 |
3.04 |
3.23 |
3.01 |
1.31 |
2.53 |
| 1995 |
3.43 |
2.75 |
2.37 |
2.20 |
2.65 |
| 1996 |
3.49 |
2.60 |
2.60 |
1.92 |
2.63 |
| 1997 |
2.66 |
3.23 |
2.63 |
1.68 |
2.50 |
| 1998 |
2.99 |
2.97 |
2.46 |
2.23 |
2.69 |
| 1999 |
2.43 |
3.02 |
2.56 |
2.34 |
2.59 |
| 2000 |
2.54 |
3.44 |
2.21 |
1.92 |
2.39 |
| 2001 |
2.09 |
2.64 |
2.79 |
2.33 |
2.62 |
| 2002 |
2.40 |
3.20 |
2.64 |
2.31 |
2.60 |
Mortality per 100,000 due to subarachnoid haemorrhage (code ICD-9 430) by geographical area, women aged 35-74 (data standardised with the European population)
|
|
North East |
North West |
Centre |
South and Islands |
Italy |
| 1980 |
7.55 |
6.83 |
3.68 |
2.25 |
4.74 |
| 1981 |
6.37 |
5.63 |
4.57 |
2.38 |
4.49 |
| 1982 |
6.10 |
4.63 |
4.79 |
2.03 |
4.23 |
| 1983 |
5.53 |
5.85 |
4.24 |
1.39 |
3.99 |
| 1984 |
5.45 |
5.57 |
4.43 |
1.73 |
4.05 |
| 1985 |
5.11 |
4.41 |
4.09 |
1.49 |
3.62 |
| 1986 |
4.93 |
4.16 |
3.81 |
1.64 |
3.58 |
| 1987 |
4.24 |
4.58 |
3.33 |
1.75 |
3.30 |
| 1988 |
4.36 |
3.95 |
2.89 |
1.81 |
3.15 |
| 1989 |
3.76 |
3.38 |
3.28 |
1.80 |
3.06 |
| 1990 |
3.96 |
3.11 |
2.92 |
1.51 |
2.77 |
| 1991 |
3.45 |
3.60 |
2.78 |
1.50 |
2.79 |
| 1992 |
3.36 |
3.14 |
3.34 |
1.18 |
2.64 |
| 1993 |
3.53 |
3.07 |
2.70 |
1.45 |
2.49 |
| 1994 |
3.45 |
3.02 |
3.31 |
1.71 |
2.72 |
| 1995 |
3.88 |
3.30 |
3.68 |
2.08 |
3.06 |
| 1996 |
3.64 |
4.15 |
3.56 |
2.32 |
3.22 |
| 1997 |
3.52 |
3.91 |
3.19 |
2.24 |
3.07 |
| 1998 |
2.99 |
5.00 |
2.64 |
2.00 |
3.09 |
| 1999 |
3.03 |
3.35 |
2.78 |
2.04 |
2.76 |
| 2000 |
2.84 |
3.72 |
3.02 |
2.51 |
2.88 |
| 2001 |
2.65 |
3.67 |
3.38 |
2.21 |
3.01 |
| 2002 |
2.92 |
3.15 |
3.34 |
2.04 |
2.81 |
© Istituto Superiore di Sanita (ISS)